Noise in the Key of D
There’s a joke about traditional Irish music that it’s all just noise in the key of D, and if you’ve ever been in a pub during an Irish session you probably understand why: it all sounds pretty much the same. Even those of us that have been playing for a while will confuse which tune is which, and sometimes switch from one tune to another halfway through by accident.
This data visualization attempts to elucidate how much similarity exists in a corpus of Irish jigs taken from The Session, an online database of Irish tunes.
Jig Network
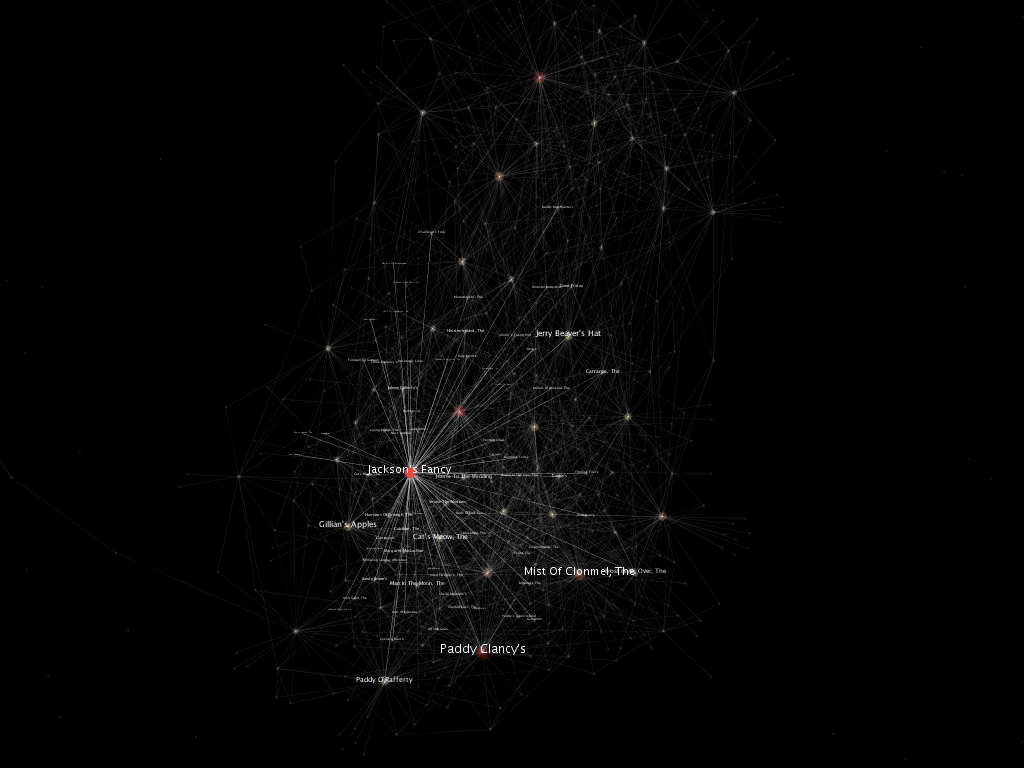
Each tune is represented as a node in a graph. Edges between tunes exist when the melodies of both tunes are similar enough. The more similar two tunes are, the stronger the edge’s weight. Using this data structure and a force-directed layout, we can render the tunes in two dimensions such that similar tunes are near each other. Each node is sized according to the weighted degree of that node: the larger the node, the more tunes it’s related to. Hovering over a node in the graph highlights that node and all of the nodes connected to it.
A few tunes stand out in this configuration. “Jackson’s Fancy”, for example, is connected to quite a few other tunes; some are quite close, while others are farther out. Perhaps “Jackson’s Fancy” is an archetypal jig, or perhaps it’s a newer, more derivative tune composed by stitching together phrases from other tunes.
I used Gephi to create a GraphML file for the network layout which I then rendered with Processing to make the interactive version of the network.
Measuring Similarity
To determine how similar a pair of jigs is, I calculate the Levenshtein distance between each pair of jigs using the ABC notation for each jig. I normalize the distance by dividing it by the length of the longer of the two tunes. I then set a threshold to exclude edges in the graph that represent a low similarity.
These calculations were all performed with the help of a Python library for musicology: music21.